I want to introduce IBM iDoctor tool to people who does not know it. Few years ago, I didn’t know the tool either, and I’ve heard lot of wired stories what the aim is. These days, I can’t live without it, and every single serious performance analysis starts with the tool. I want to show you in very simple steps how to do a basic analysis. Not sure if you know, but the tool is available with 45-days free trial. So, you can give a try without paying a single penny, or ordering an expensive consultant. Why do I even write about an iDoctor which is an extra charged product ? I do it for couple of reasons:
- Most of IBMi admins get to a performance issues and personally I heard dozen of times stories “We need to buy an extra CPU because our system is slow”. Increasing a CPU would help in most situations but the real problem might be slow disk, wrongly set journaling or application locks. With the tool you can easily find out.
- There is a light version of “iDoctor” embedded in every IBMi OS, know as PDI – Performance Data Investigator. Which is nothing else as limited version of iDoctor integrated into IBM Navigator for i – build on Java. Thus, if you understand the logic in the iDoctor (which work flawless), you can easy switch to sluggish PDI. The performance data can be analyzed with both tools. But iDoctor takes you to microscopic details, that is why it is widely used by IBM support, Lab Services, and business partners. PDI is very likely targeted to ‘small shop’ type of customer.
- By optimizing the application or system, you very likely would save some money on CPU licenses or an extra hardware, this is very likely also a braking point which justify investment into the tool. Take into account that the iDoctor is sold as a service. Therefore you pay for every year of using the tool.
What exactly IBM iDoctor does? It illustrates data collected via Performance Tools (PT1) into nice looking graphs. The tool has a lot of other functionality such as, illustrating VIOS data, Job Watcher collection, Plan Cache, Disk Watcher and many more. But in this post, I focus on PT1 data only with basic functionality.
Do you need to install iDoctor on every LPAR? I run the tool only ‘non-production’ LPAR for couple of reasons. If a performance problem appears on the production LPAR, you definitely don’t want to utilize the LPAR more by running performance analysis. The other reason is the license. iDoctor is charged for an entire machine, and pricing depends on the processor tier. Thus, if you run multiple P30 machines and P05, definitely the license for P05 will be a way cheaper. Then, you can always move over the performance collection data from P30 to P05 and run analyses.
Interval retention. As you know PT1 can record collections in different intervals. The default value is 15 min. I recommend change to 5 min if you are working on some problems. Definitely I do not recommend value bigger than 15min. If it very difficult find a real problem if you work on average from 30 min intervals
To start the analysis, you need to install iDoctor server package on IBMi LPAR and a client module on a Windows workstation. Always get the latest version and install an update whenever it is available.
Get temporary license key mailing to idoctor@us.ibm.com (if a trial key expires, you can always ask for renewal).
Here is a step by step procedure to work with iDoctor for beginners.
- Move performance data from the system which you want to analyze to iDoctor LPAR, and start the tool.
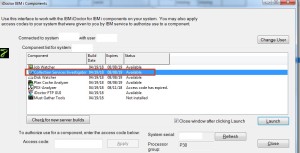
- Enter the Access code and Launch Collection Service Investigator.
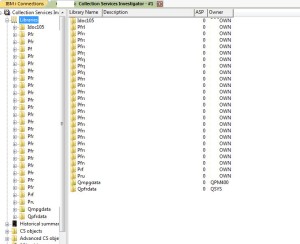
3. Select the library where the performance data which you want to analyze is located (good thing is that iDoctor detects all libraries with PT1 data)
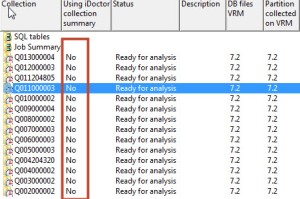
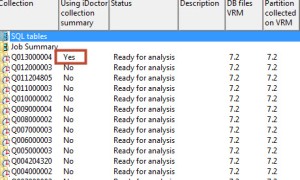
4. Now, you should see all members created by PT1 starting Q0… These are the same objects which you see when you do GO PERFORM and OPT7- Display performance data. Take a look to the second column “Using iDoctor collection summary”, it shows No.
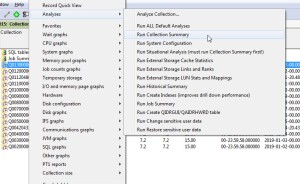
5. Select a member which you want to analyze (or many using Ctrl), and right mouse click Analyses -> Run Collection Summary. It prepares the data for quick iDoctor analysis.
6. It allows you to submit a job which creates a summary and prepares the data for iDoctor analysis. In the main iDoctor window, you should get a new tab “Remote SQL Statement Status” with “in progress” status and once it is done “Collection summary created…” Status. The step might take significant amount of time, it depends of the machine resources and number of data.
7. Once the process completes, In the main Collection Services Investigator tab , column “Using iDoctor collection summary”, shows Yes. Now your data is ready to being analyzed in the iDoctor.
8. Now, we can start to work with performance data, the assumption is that we don’t know what factor slows down our system the most. In order to find out the high level overview, I suggest following:
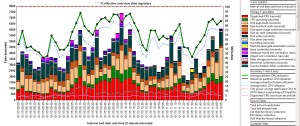
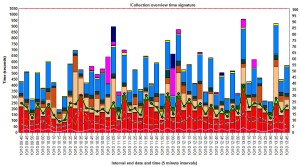
On the converted PT1 member, right mouse click and select “Wait graphs” and “Collection overview time signature”. It opens a new iDoctor window with funky graph.
9. On the “Collection overview time signature” graph, move to the busiest part of the day, and look to the colors of specific bars. This should give you an idea where the problem is. Below you can find several examples where the problems were caused by different factor.
Example when performance was affected by slow storage write IO
9a. Problem with an external storage. In the graph below, you can see pretty big dark blue bars – which means a significant time for jobs took writing to disks. This is usually very bad, because a system either push more data than a storage configuration can absorb or there is something wrong with the storage.
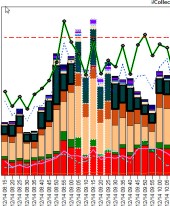
10a. So, I move the graph to 9am, where a CPU utilization is very high and left click on bar at 09:05, holding a Shift key and clicking again at 09:20. As you can see below, the tool highlighted data from 09:05 till 09:20, therefore all calculation will be done among selected period.
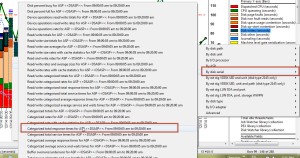
11a. Now, I want to see what was the write response time in this specific time for LUN. Right click on the graph Rankings -> Disk graphs ->By disk serial -> Categorized total response time for ASP
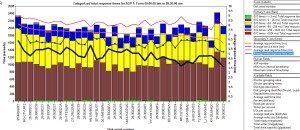
12a. This will produce a new tab with several graphs, but we are interested in the Average write response time (ms). You can see that in my example it was between 4-6ms per LUN. Which is pretty a lot (not too bad bad, but it might be an obstacle in the application flow). Very useful information is also a disk serial number, if we see some significant difference for particular LUN, we can start the investigation on the storage why the LUN is so slow.
In this particular example, the V7K storage, got enabled several features (compression, and Global Mirroring) which affects the storage CPU heavily, that it could not handle write IO in acceptable limits. When GMIR was disabled, write IO dropped to ~1ms.
Example when performance was affected by wrong journaling setup.
9b. The “Collection overview time signature” graph, shows following information, take a look into high light blue bars. These shows lot of time spend because of journaling
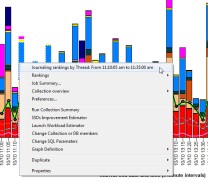
10b. Take a specific period from 11:05 to 11:35,and right mouse click “Journaling rankings by Thread..”. This shows the threads the hardest affected by journaling.
11b. As you see that are operating system jobs, and journaling is unbelievable big part of it.
In this example, there was heavy journaling setup. I believe it was a result of old MIMIX configuration. Almost all files recorded *BOTH images into dozen of existing of journals. Because the application support was not able define what journals are really needed (and MIMIX was no more in use) we decided to enable journal caching for the most heavy journals. It speed up the application about 5 times.
Example when LPAR almost stopped, shows CPU utilization 100% caused by application lock.
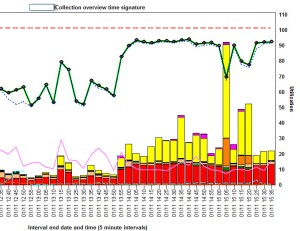
9c. The “Collection overview time signature” graph, shows following information. Take a look to yellow bars – this is time spent in Machine level gate serialization. Again, I’ve been told – ‘we need more CPU, our system stopped’.
PT1 reports CPU utilization around 93%, and LPAR2RRD flat 100% after 15:00
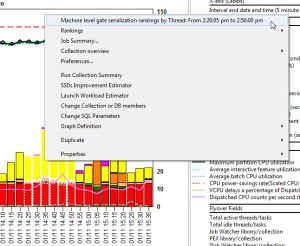
10c. Take a specific period from 2:20 to 2:50 pm,and right mouse click “Machine level gate serialization rankings by thread…
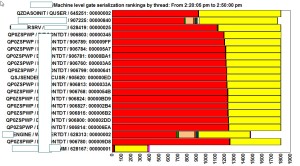
11c. This shows the threads with the highest Machine level gate serialization. In my example, there are multiple threads with the same application user name. Therefore, it points me to a problem with the application.
I checked QP0ZSPWP job logs, and all looks the same. These were Java jobs, so nothing in call stack but job logs were completely unhealthy. Machine level gate serialization is sort of queue where a job waits in line waiting to run. This is on SLIC level. When I saw multiple application jobs in such condition, it was clear that the application is in sort of dead lock. And it really was – the application team made some in proper cleaning.
How to check what is filling an ASP
For this particular situation, I don’t have performance data which shows quick grow on ASP. But I found a situation when someone delete on disks which made significant drop on ASP. The steps are exactly the same if you want to see what jobs filling the ASP.
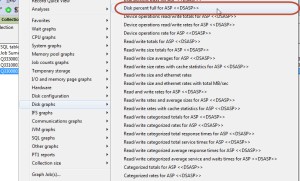
9d. In this situation we know that fast growing ASP is a problem, not a wait time bucket.Therefore, from the main window (Collection Services Investigator) instead of clicking “Collection overview time signature” select right click and Disk graphs-Disk percent full for ASP. If we ASP utilization grows very likely it is caused by write IO operations.
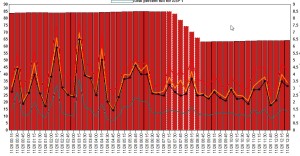
10d. It presents how ASP utilization changed within time. In my particular example, there is significant drop between 7:15 to 8:30 (someone delete lot of data).
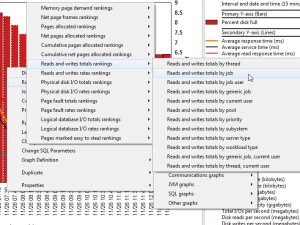
In order to see what caused this change, select period from 07:15 to 08:30 and right click Rankings ->I/O and memory page graphs ->Reads and writes total rankings ->Reads and writes totals by job
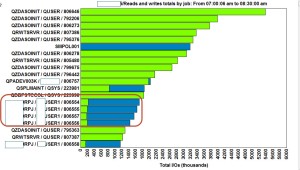
11d. Next graph shows jobs which did the most reads and writes within specific period. We are interested in Total writes (blue graphs). These are the job which utilize ASP the most.
If you have a situation when ASP fast growing, write IO jobs definitely will be at the top on the screen.
How to check if memory is sized correctly
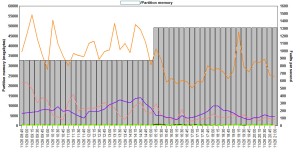
In the end, one of my favorite graphs, which allows a way better sizing of RAM for IBMi LPAR. Memory pools are difficult for sizing, usually we let system to do it and move memory across the pools. If there is not enough memory it is visible by heavy paging, but what if there is too much memory in a pool? There is a nice graph which help us.
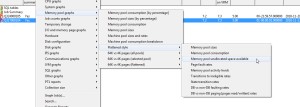
9e. From Collection Service Investigator select a member with collection data and right click -> Memory pool graphs -> Flattened style -> Memory pool unallocated space available
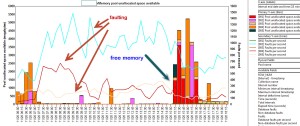
10e. The graph shows, how much memory the memory pools deallocated ( in another words – how much spare memory was in the pool). In my example, you can see that during the day (from 07:15 till 15:00) there was no spare memory available, plus there was high faulting on pools (line graphs).
At 15:15 you can see bars which grown and faults dropped. This is because the memory was added to the LPAR.
The system had not enough memory during the day, and faulting was high, at 15:15 memory was added thru DLPAR operation. It took about an hour to add this memory to the pools at the same time, faulting significantly dropped. At 16:45 all extra memory was again almost fully consumed.
From the graph below, you can see exactly at 15:15 16Gb memory was added to the LPAR.
Short summary, the iDoctor is from my perspective one of the best tools I have every worked with. At the very first time it is complicated because it provides tremendous number of graphs, it takes time to realize what a specific graph is about. I recommend to do some iDoctor analysis by application developers too. If the application uses a database system API, or IBM i services it is better to check how it impacts the machine.
What I don’t understand is IBM strategy, I believe iDoctor brings sufficient revenues to produce some materials for users. Basically, there is no examples, manuals available online. The Redbook was created a long time ago and basically it is useless for a beginners because the interface has changed a lot since then. Anyway, I hope that you are going to find some valuable information in this post.



Great Article, Bart! I too use iDoctor, it does take time to learn the tool and even more time to understand what the data means. But once you do start to understand it, it’s pretty powerful stuff.
Hello Bart,
my customer would like to see say list of top 100 most accessed files with number of read/writes/update per each.
is that something that iDoctor is suitable for?
Very strange request. Number of write/updates operations do not define performance problems. This sounds to me more what Job Watcher collection is able to collect (not performance collection). Job Watcher data can be also analyzed in iDoctor but it is not covered in my blog.
Thank Bart, well, they would like to find out which files (like small parm files) are frequently accessed so they can move them into main storage pool (setobjacc).
In such case, definitely the Job Watcher collection must be taken and analyzed.
I can help you with if you are interested…..
Bart, send in some tips please
Amazing post !!! Thanks Bart 🙂