Not sure if there is anyone in IT world who has not heard about latest vulnerabilities in the modern chips. In this post I cover performance impact caused by fixes on IBM Power Systems and and IBM i OS.
A security vulnerability is nothing new, but this time the problem seems to be very serious and the way of solving it might be very expensive from a performance point of view. From information what we got so far, it looks that almost every modern chip which uses speculative processing is affected. The only way how to solve it, is to redesign the chip or patch the OS in the way that it will not allow to use this vulnerability. On x86 platform we heard about performance degradation from 20-40% depending on the workload. And what about IBM Power Systems?
Unfortunately, IBM is very conservative in published information regarding the vulnerability. We don’t know how difficult is hack any information processed by POWER chips. I have never heard about any proven attack on IBMi or AIX. Nevertheless, IBM has already delivered number of patches.
The first patch was delivered on January 9th. It was the server firmware fix, SC860_138 for POWER8 and equivalent for POWER7+. The fix is concurrent as long as you run the latest release level. If not, a server reboot is needed. I had no performance impact once this fix get applied. But in the fix description there is an information that an Operating System updates are required too.
January 10th, IBMi PTFs were released : 7.1: MF64553, 7.2:MF64552, and 7.3:MF64551. The PTFs require an IPL. The cover letter is very mysterious, doesn’t say much. Getting the PTF on the system was a big question mark and probably many users still feel uncomfortable with number of available information. IBM did not publish any official information about potential performance impact, neither how the security flaw was solved. No information if it changes behavior of cache, CPU or OS.
We have carefully put this patch to test systems and closely monitored the performance. The easiest and the quickest way to see a performance change for us is to read LPAR2RRD graphs. This tool collects statistics delivered by the HMC, which are the processor cycles dispatched by the Power Hypervisor. I wrote a post how to collect it few years ago here. This data is far away from precise capacity information, but I said before, this is the quickest way.

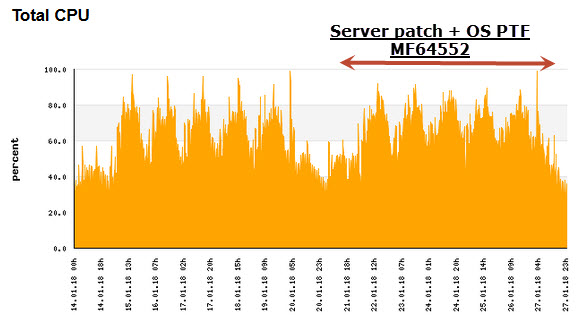
This graph represents a CPU pool with 38 allocated CPUs. Over the weekend 20/21st January, the machine gets a firmware patch and few OS instances get PTF MF64552. As you can see, there is almost the same utilization, no spectacular grow.
Next , I went deeper and selected the PTFed LPAR which run some predictive steady traffic.
As you can see, no significant grow after patching. The graph looks very similar. So, this was the PHYP graph, what about the OS?
Actually, in the OS (V7R2) no performance degradation noted either. The graph below is our “in house” way of presenting PT1 performance data. In another words, it illustrates exact numbers which can be found in GO PERFORM tool.
There is almost no difference in CPU utilization.
Later, I went a bit deeper again ,and I used IBM iDoctor to see very detailed statistics. From the same system I took the performance data from Monday (Jan, 16th) when the LPAR was without firmware fix and the OS PTF, and a week later (Jan, 22nd) when FW SC860_138 and PTF MF64552 were applied.
I did a query – show me the jobs which consumed CPU the most. On the left side, you see job ED_PROC was the biggest consumer of CPU for entire day, and it used ~9500 CPU sec. On the right side, the same report a week later, again the same job was the biggest consumer and it used about ~7200 CPU sec.


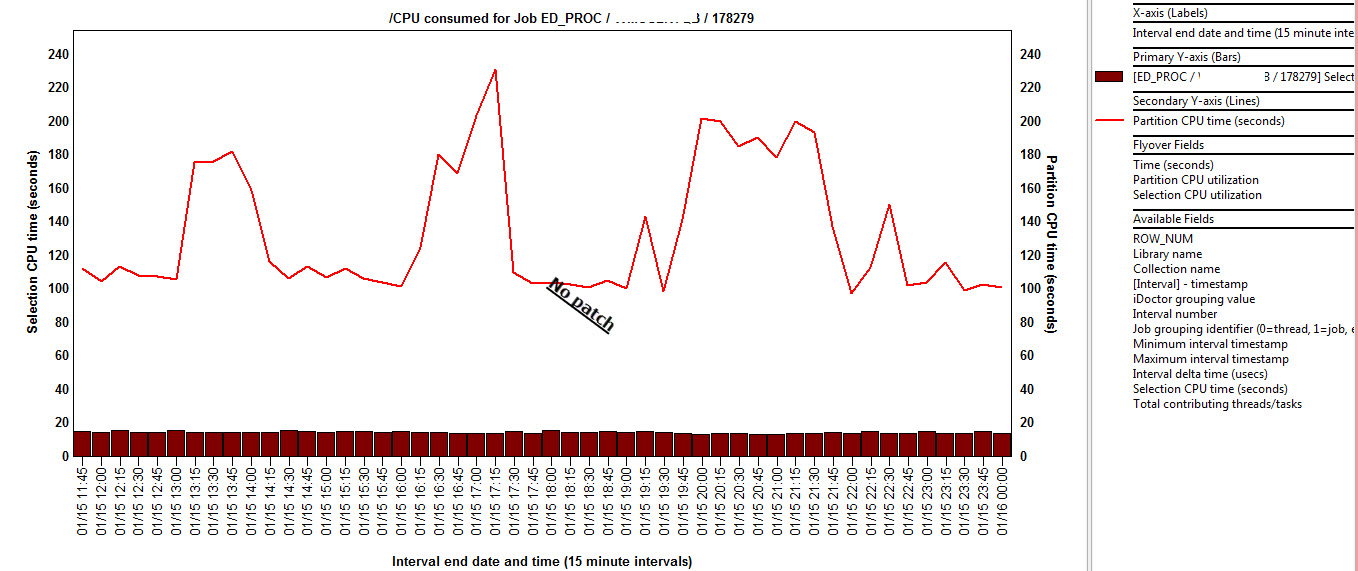
Another funky iDoctor graphs shows how much CPU time was used for this specific job (small brown bars) vs total CPU for entire Lpar. Left graph before patches, right one with patches. There is no difference again.

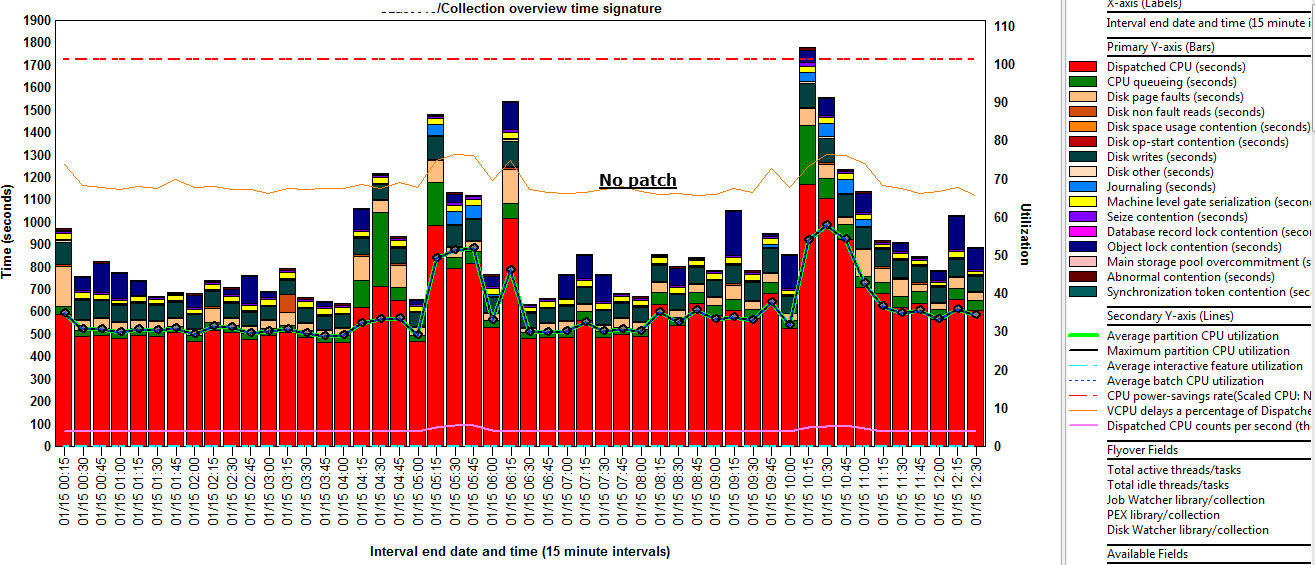
In the end you can compare wait graphs before and after, and here there are no significant changes either. Nothing like slower IO, more CPU queuing, etc.

This detailed performance analysis were done against performance data on one of our development/test LPAR. I didn’t do such detailed analysis for every system which already received OS PTF.
I will try to update this post within next days, because last Friday (26.01) another set of PTFs was released: 7.1: MF64571, 7.2:MF64565, 7.3:MF64568. Cover letter again is very mysterious. IBM claims these PTFs are specific for POWER8 models, and are required to mitigate the problem.
Of course, I have no idea what these or those PTFs fixed. I just believe they did something. From the other hand, IBM still have doors open, because following information can be found on the IBM blog “IBM i operating system patches are now available via FixCentral and will continue to be rolled out through February 12″
In terms of performance issue for MF64565 I can’t say much so far. Today ( Jan 31st) we applied the fix on few test systems. No performance changes were observed, but these systems can’t be taken as reference due to very small workload.
Do not forget that fixes for VIOSes were released as well. These I will installed within next days, and will try to deliver performance update to.
UPDATE 27.02.2018
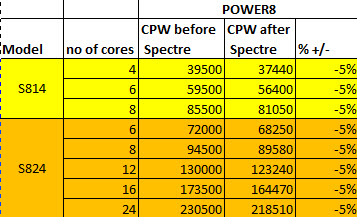
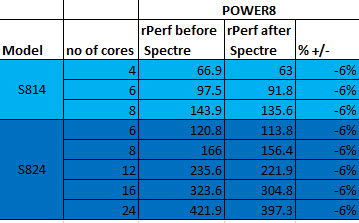
Since the post was written, IBM released few more PTFs for IBMi. The roll out takes time. I still did not everything, but except fixes listed above there are MF64598, MF64601, MF64607, MF64611, MF64614 and MF64696, MF64697 released few days ago. Anyway IBM released today an official benchmark result, where all machine comes up with NEW CPW and rPerf numbers. Doing a simple math, IBM PowerSystems lose 5-6% CPU performance in order to mitigate these vulnerability.

Outstanding update, thank you for sharing!
Any updates on that topic, in special for performance issue by the VIO fixes?
not yet. Patching is scheduled in waves. I will be giving updates in comming weeks.
Looking forward to any impact analysis of February 22nd PTF’s.
Very usefull information. It includes awaited link to performance figures of new POWER9 scale out servers. Thank U
If only the bottom graph had our POWER7 represented 8202-E4D. We are slowwwwwww.